

5 Ways to Implement a Local SEO Strategy That Gets Results
Do you want more sales than ever before? Then it's time to review and revamp your local SEO strategy!


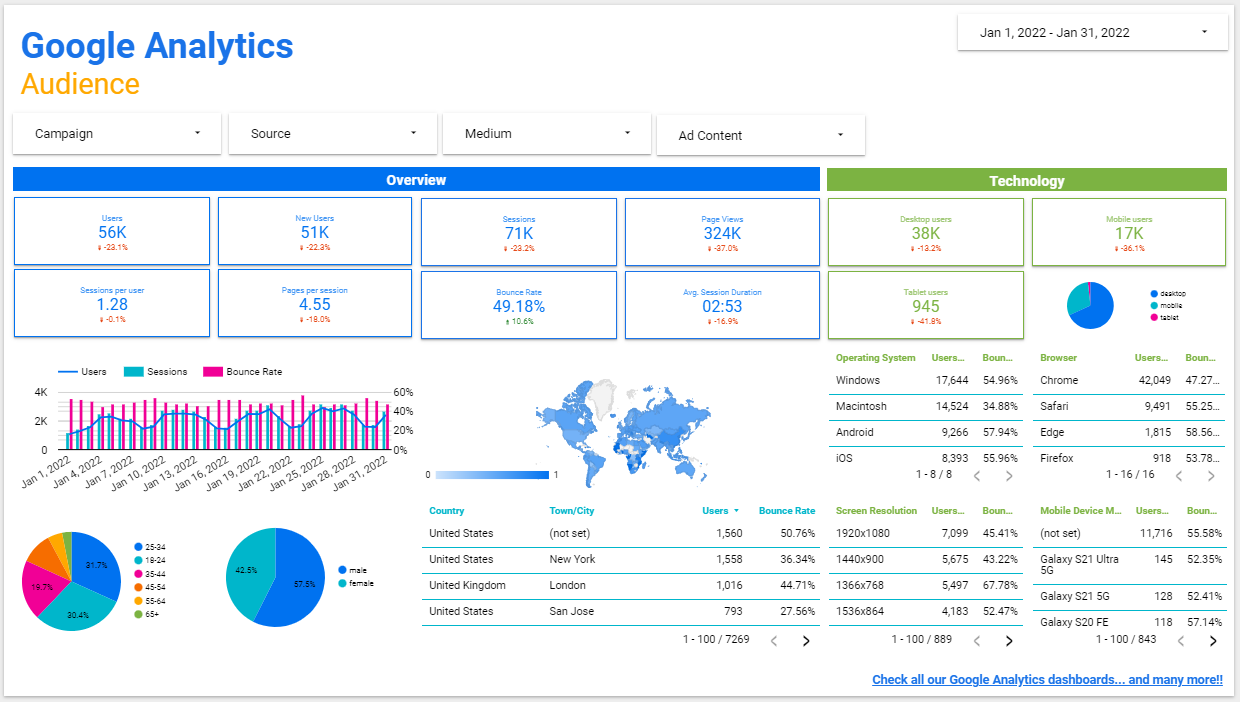
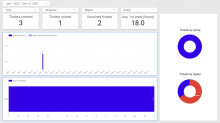
This free Google Data Studio dashboard is perfect to analyze your website audience at a glance!
We have splitted this dashboard KPIs into 2 main sections: Overview and Technology.
This Google Data Studio dashboard includes 4 filters to filter your data based on UTM information.
KPIs available as Scorecards: Users, New Users, Sessions, Page Views, Sessions per User, Pages per Session, Bounce Rate, Avg. Session Duration
KPIs available in the Line chart #1: Users, Sessions, Bounce Rate
KPI available in the Pie chart #1: Age
KPI available in the Pie chart #2: Gender
KPIs available in the Geo chart #1: Sessions
KPIs available in the Table chart #1: Country, Town/City, Users, Bounce Rate
KPIs available as Scorecards: Desktop Users, Mobile Users, Tablet Users
KPI available in the Pie chart #1: Device Category
KPIs available in the Table chart #1: Operating System, Users, Bounce Rate
KPIs available in the Table chart #2: Browser, Users, Bounce Rate
KPIs available in the Table chart #3: Screen Resolution, Users, Bounce Rate
KPIs available in the Table chart #4: Mobile Device Marketing Name, Users, Bounce Rate
KPIs used as Filters: Campaign, Source, Medium, Ad Content
Our team would be more than happy to help you on your Digital projects!